Metrics and Monitoring
Monitoring the cluster via Prometheus
Most components of STRM Privacy expose Prometheus metrics and we've included the Prometheus Cluster Operator Helm chart. In order to define scrape targets to Prometheus, we deploy Service Monitors that expose the metrics endpoints in the Event Gateway.
The kubectl commands below assume a default namespace of strmprivacy, which you can set via kubens strmprivacy
Prometheus server
Access the Prometheus server either via telepresence or via a port-forward
kubectl port-forward service/strmprivacy-kube-prometheu-prometheus 9090:9090&
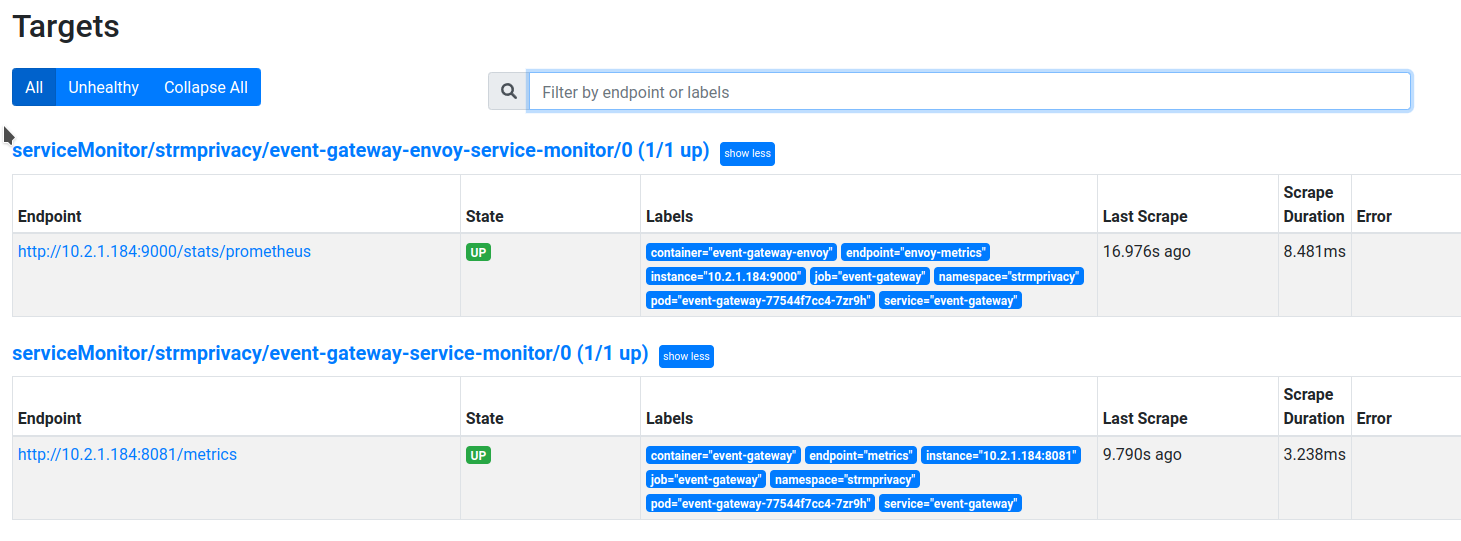
You should see the Event Gateway in the service discovery
- serviceMonitor/strmprivacy/event-gateway-envoy-service-monitor/0
- serviceMonitor/strmprivacy/event-gateway-service-monitor/0
and the targets
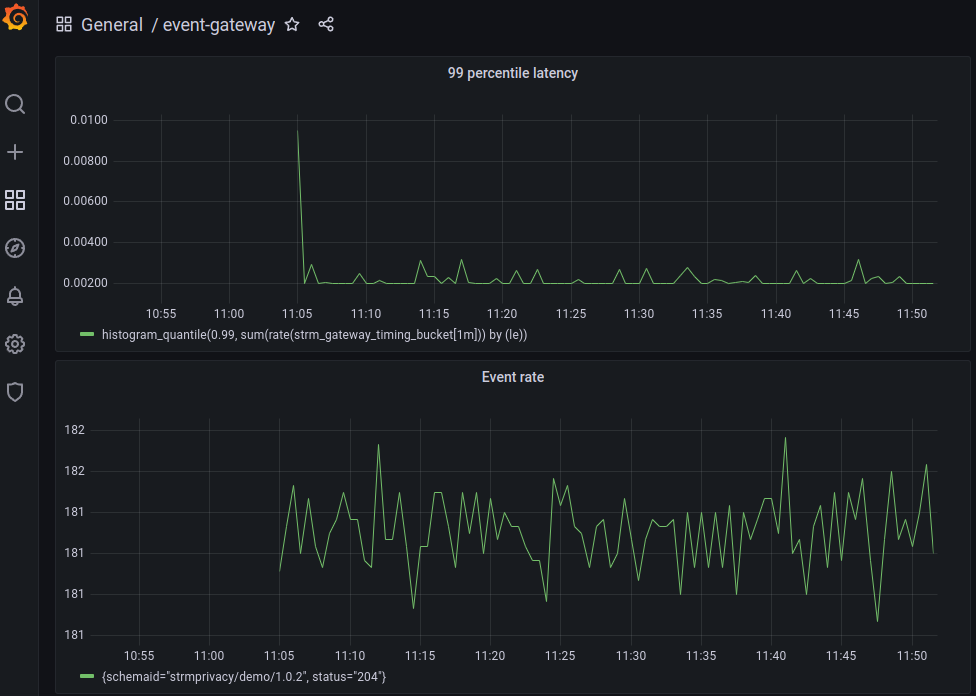
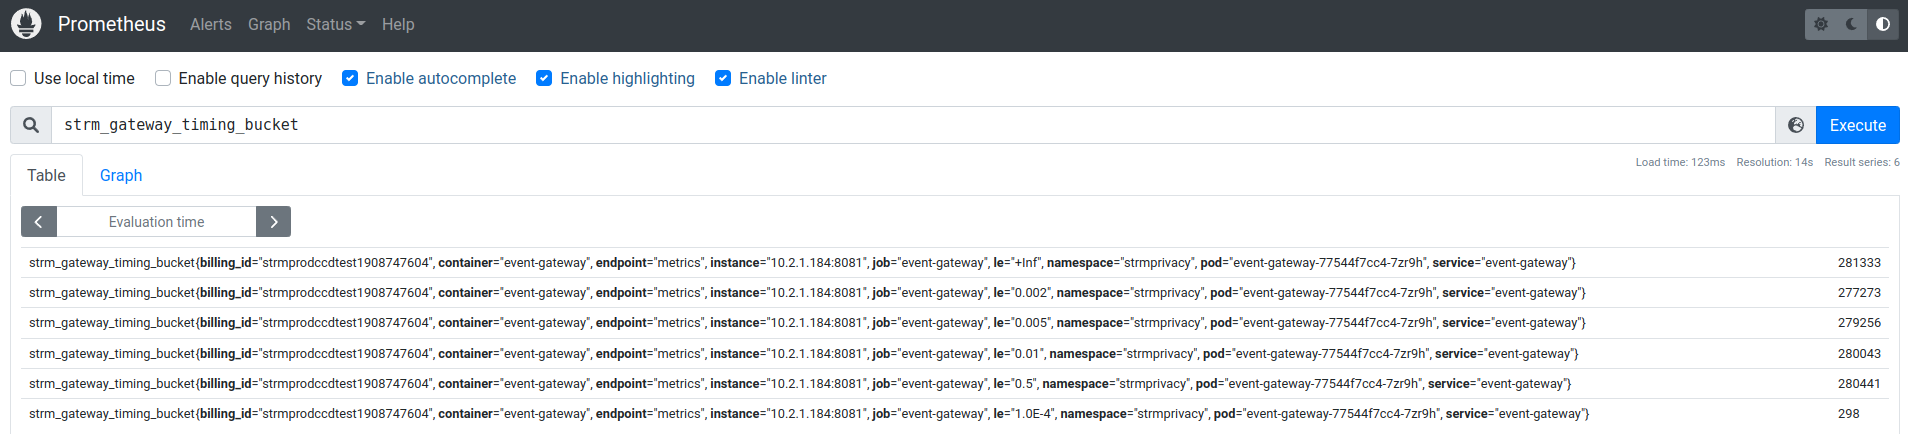
If you have the simulator running, you could have somewhat interesting timing data:
Grafana
The CCD quickstart also includes a Grafana instance, that we can port-forward
kubectl port-forward service/strmprivacy-grafana 4000:80&
Log in to Grafana with username admin and password prom-operator (the value of
the secret named strmprivacy-grafana).
I've added two panels for the very simple dashboard we show here: